API Path Metrics Dashboard
Overview
The API Path Metrics Dashboard provides detailed, endpoint-specific metrics for individual API paths. Unlike the API Request Dashboard which shows aggregated metrics across all endpoints, this dashboard allows you to drill down into specific paths to analyze their performance, traffic patterns, and error rates. This is ideal for investigating specific endpoints, optimizing latency-critical paths, and understanding endpoint-level behavior.
Key Features
- Path Selection: Dropdown selector to choose specific API paths
- Endpoint-Specific Metrics: All metrics filtered to the selected path
- Performance Analysis: Response time percentiles and averages for the selected path
- Error Breakdown: Detailed error rates by status code for the path
- Traffic Patterns: Request rates and method distribution for the path
- Real-time Monitoring: Live metrics updated continuously from Prometheus
Dashboard Structure
The dashboard is organized into two main sections with all panels filtered by the selected path:
- Request Rates - Request volume, errors, and method distribution (5 panels)
- Response Time - Response time metrics and success rates (2 panels)
Path Selection
Path Dropdown
Description: Template variable dropdown at the top of the dashboard that allows you to select which API path to analyze.
Options:
- All: Shows metrics for all paths (uses regex
.*) - Specific Path: Select any individual path from the list
Query:
label_values(http_server_duration_milliseconds_count{job="otel-collector", namespace="dynamoai"}, path)
Use Cases:
- Focus analysis on specific endpoints
- Monitor latency-critical endpoints
- Compare different paths
Request Rates
This section provides detailed analysis of request patterns, errors, and method distribution for the selected path.
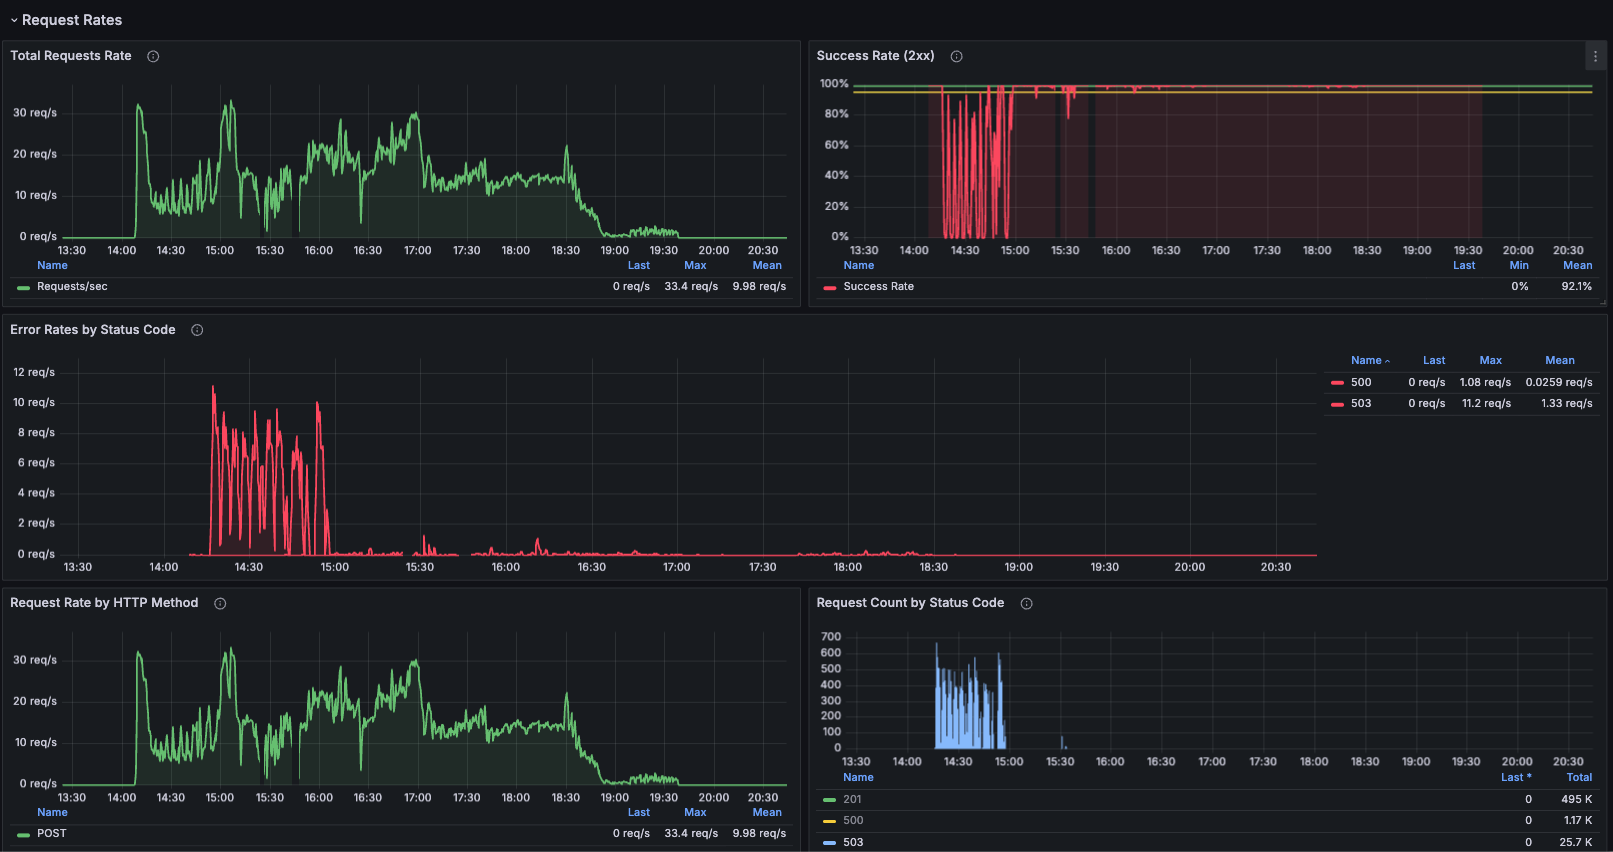
Total Requests Rate
Description: Time-series graph showing the request rate per second for the selected path.
Metrics:
- Requests per second (req/s)
- Filtered to the selected path
Query:
sum(rate(http_server_duration_milliseconds_count{job="otel-collector", namespace="dynamoai", path=~"$path"}[1m]))
Error Rates by Status Code
Description: Breakdown of error rates showing the rate for each specific status code (excluding 2xx) for the selected path.
Metrics:
- Individual status code rates (400, 401, 403, 404, 500, 502, 503, 504, etc.)
- Rate per second for each status code
- Excludes 2xx status codes
Query:
sum by (status) (rate(http_server_duration_milliseconds_count{status!~"2..", job="otel-collector", namespace="dynamoai", path=~"$path"}[1m]))
Request Rate by HTTP Method
Description: Breakdown of request rate by HTTP method (GET, POST, PUT, DELETE, etc.) for the selected path.
Metrics:
- Request rate per second for each HTTP method
- Method distribution over time for the path
Query:
sum by (method) (rate(http_server_duration_milliseconds_count{job="otel-collector", namespace="dynamoai", path=~"$path"}[1m]))
Request Count by Status Code
Description: Total request count over time grouped by HTTP status code for the selected path, displayed as a stacked bar chart.
Metrics:
- Total request count by status code
Query:
sum by (status) (increase(http_server_duration_milliseconds_count{job="otel-collector", namespace="dynamoai", path=~"$path"}[$__rate_interval]))
Response Time
This section provides detailed analysis of response time metrics and success rates for the selected path.
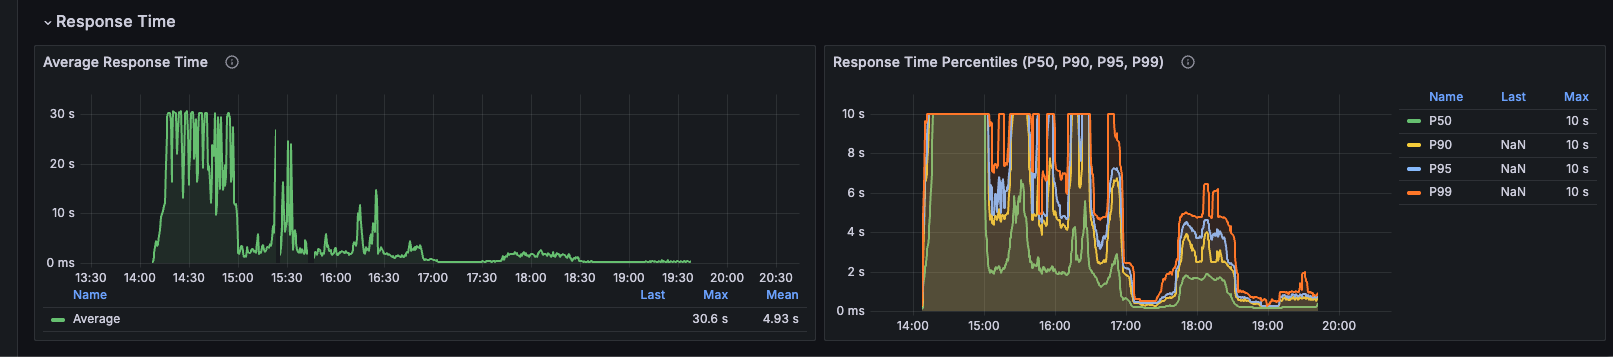
Average Response Time
Description: Time-series graph of average response time in milliseconds for the selected path.
Metrics:
- Average latency (ms)
- Filtered to the selected path
Query:
sum(rate(http_server_duration_milliseconds_sum{job="otel-collector", namespace="dynamoai", path=~"$path"}[1m])) / sum(rate(http_server_duration_milliseconds_count{job="otel-collector", namespace="dynamoai", path=~"$path"}[1m]))
Interpretation:
- Average latency for the selected path
Response Time Percentiles (P50, P90, P95, P99)
Description: Comprehensive latency distribution showing multiple percentiles for the selected path.
Metrics:
- P50 (Median): 50% of requests complete within this time
- P90: 90% of requests complete within this time
- P95: 95% of requests complete within this time
- P99: 99% of requests complete within this time
Queries:
# P50
histogram_quantile(0.50, sum by(le) (rate(http_server_duration_milliseconds_bucket{job="otel-collector", namespace="dynamoai", path=~"$path"}[5m])))

# P90
histogram_quantile(0.90, sum by(le) (rate(http_server_duration_milliseconds_bucket{job="otel-collector", namespace="dynamoai", path=~"$path"}[5m])))

# P95
histogram_quantile(0.95, sum by(le) (rate(http_server_duration_milliseconds_bucket{job="otel-collector", namespace="dynamoai", path=~"$path"}[5m])))

# P99
histogram_quantile(0.99, sum by(le) (rate(http_server_duration_milliseconds_bucket{job="otel-collector", namespace="dynamoai", path=~"$path"}[5m])))
Use Cases
Latency-Critical Endpoint Monitoring
- Select latency-critical endpoint (e.g., DynamoGuard Analyze Requests)
- Monitor P90/P99 response times to ensure requirements are met
- Track success rate and error rates
Endpoint-Specific Incident Investigation
- Select the affected path
- Check Success Rate and Error Rates by Status Code
- Review Average Response Time and percentiles
- Analyze traffic patterns (Total Requests Rate, Request Rate by HTTP Method)
Technical Details
Metric Details
All metrics are collected via OpenTelemetry instrumentation using nestjs-otel:
Histogram Metrics (for response times):
http_server_duration_milliseconds_sum: Total duration sumhttp_server_duration_milliseconds_count: Total request counthttp_server_duration_milliseconds_bucket: Histogram buckets for percentiles
Labels Available:
method: HTTP method (GET, POST, PUT, DELETE, etc.)path: API endpoint path (used for filtering)status: HTTP status codenamespace: Kubernetes namespace (dynamoai)job: Prometheus job label (otel-collector)
Path Filtering
All queries use the path=~"$path" filter where $path is the template variable:
- When "All" is selected:
$path = ".*"(matches all paths) - When a specific path is selected:
$path = "/api/v1/endpoint"(matches that exact path)
The =~ operator uses regex matching, allowing for pattern-based path selection.
Last Updated: [Current Date]