Visualization
- Capturing metrics is not enough, it's important to have a place where you can immediately go to and watch the trends of the metrics over time
- We ship Grafana configured by default with
- Prometheus instance that has all the metrics as a data source
Where can you view the dashboards?
Endpoint
The endpoint can be different in different scenarios
- If ingress enabled
<ui-endpoint>/grafana- E.g
https://staging.dynamofl.com/grafana
- else
- Domain specific in deployment configuration
- E.g
https://grafana.dynamofl.com
Creds
Configured via the deployment config
- Default username:
admin - Password: get it from the deployment team
Dashboards
API
HTTP Stats
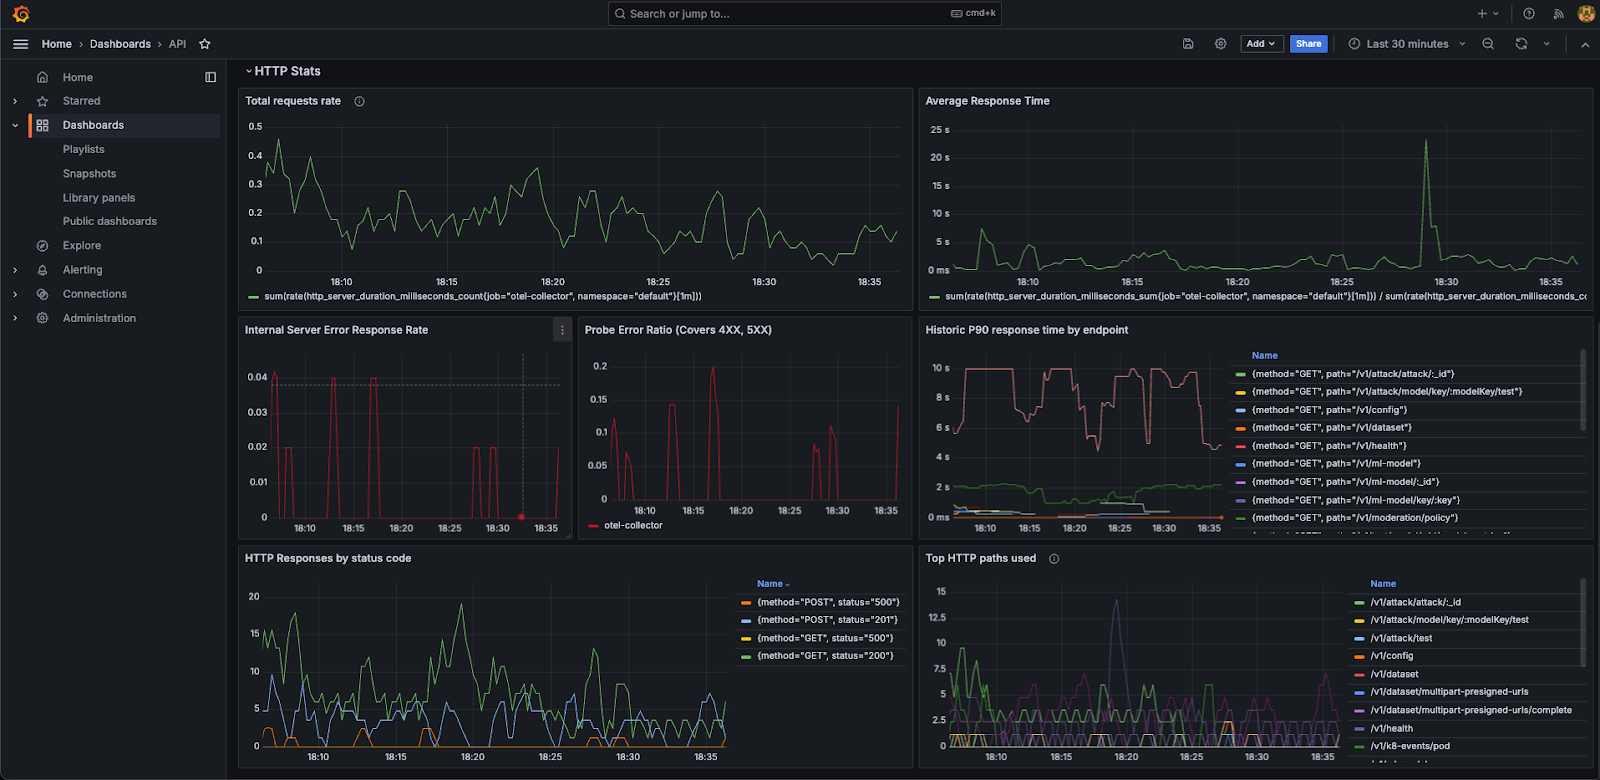
Panel Breakdown
| Panel Name | Description |
|---|---|
| Total Requests Rate | Rate of total requests |
| Average Response Time | Average response time across all endpoints |
| Internal Server Error Response Rate | Requests with internal server error / Total requests |
| Probe Error Ratio | Requests with errors of 4xx, 5xx / Total requests |
| Historic P90 response time by endpoint | P90 response time by different endpoints of the API |
| HTTP Responses by status code | HTTP responses over time with a given status code |
| Top HTTP Paths used | Number of HTTP requests by path over time |