CloudWatch Logging Guide
- This guide covers CloudWatch-specific implementation details for viewing and querying DynamoAI logs
- Applicable to: SaaS deployments (where logs are automatically exported to CloudWatch) or PaaS deployments using CloudWatch as the logging backend
CloudWatch Terminologies
Before exploring logs in CloudWatch, it's helpful to understand these key concepts:
| Terminology | Description |
|---|---|
| CloudWatch Log Group | Log groups define groups of log streams that share the same retention and monitoring settings. All DynamoAI application logs are stored in a single log group per cluster. |
| CloudWatch Log Stream | A log stream represents the sequence of events coming from a specific application instance or resource (e.g., a Kubernetes pod). Each pod gets its own log stream. |
Log Group and Stream Mapping
DynamoAI logs are organized in CloudWatch using the following structure:
Log Group Naming Convention
All application logs are stored in a single log group per cluster:
/aws/containerinsights/${CLUSTER_NAME}/application
Where:
${CLUSTER_NAME}is your Kubernetes cluster name (e.g.,dfl-prod-default-eks)
Example: /aws/containerinsights/dfl-prod-default-eks/application
Note: All components (API, MongoDB, DynamoEval jobs, etc.) share the same log group regardless of namespace.
Log Stream Naming Convention
Log streams follow this pattern:
${POD_NAME}.${CONTAINER_NAME}
Where:
${POD_NAME}is the Kubernetes pod identifier (e.g.,dynamoai-api-56fcf74495-rf2pj)${CONTAINER_NAME}is the container name (e.g.,dynamoai-api,mongodb,db-migrations-job)
Component Log Stream Examples
| Component | Log Stream Example |
|---|---|
| API | dynamoai-api-56fcf74495-rf2pj.dynamoai-api |
| DB Migrations Job | db-migrations-job-vz564.db-migrations-job |
| Moderation Server | dynamoai-moderation-5bdc4cb97d-45wgd.dynamoai-moderation |
| MongoDB | dynamoai-mongodb-1.mongodb |
| DynamoEval Attack | scaled-job-cpu-1-2-t86sv-scszp.redis-client |
| Test Report Generation | testreportgeneration-cpu-1-rf8vz-xcsd4.redis-client |
| Mini Fine Tune Job | mini-finetune-l4-1-kr6wc-xnc5p.redis-client |
Note: A new log stream is created whenever a new pod is created. When a pod is terminated, its log stream remains in CloudWatch (subject to retention policies).
Viewing Logs: Two Approaches
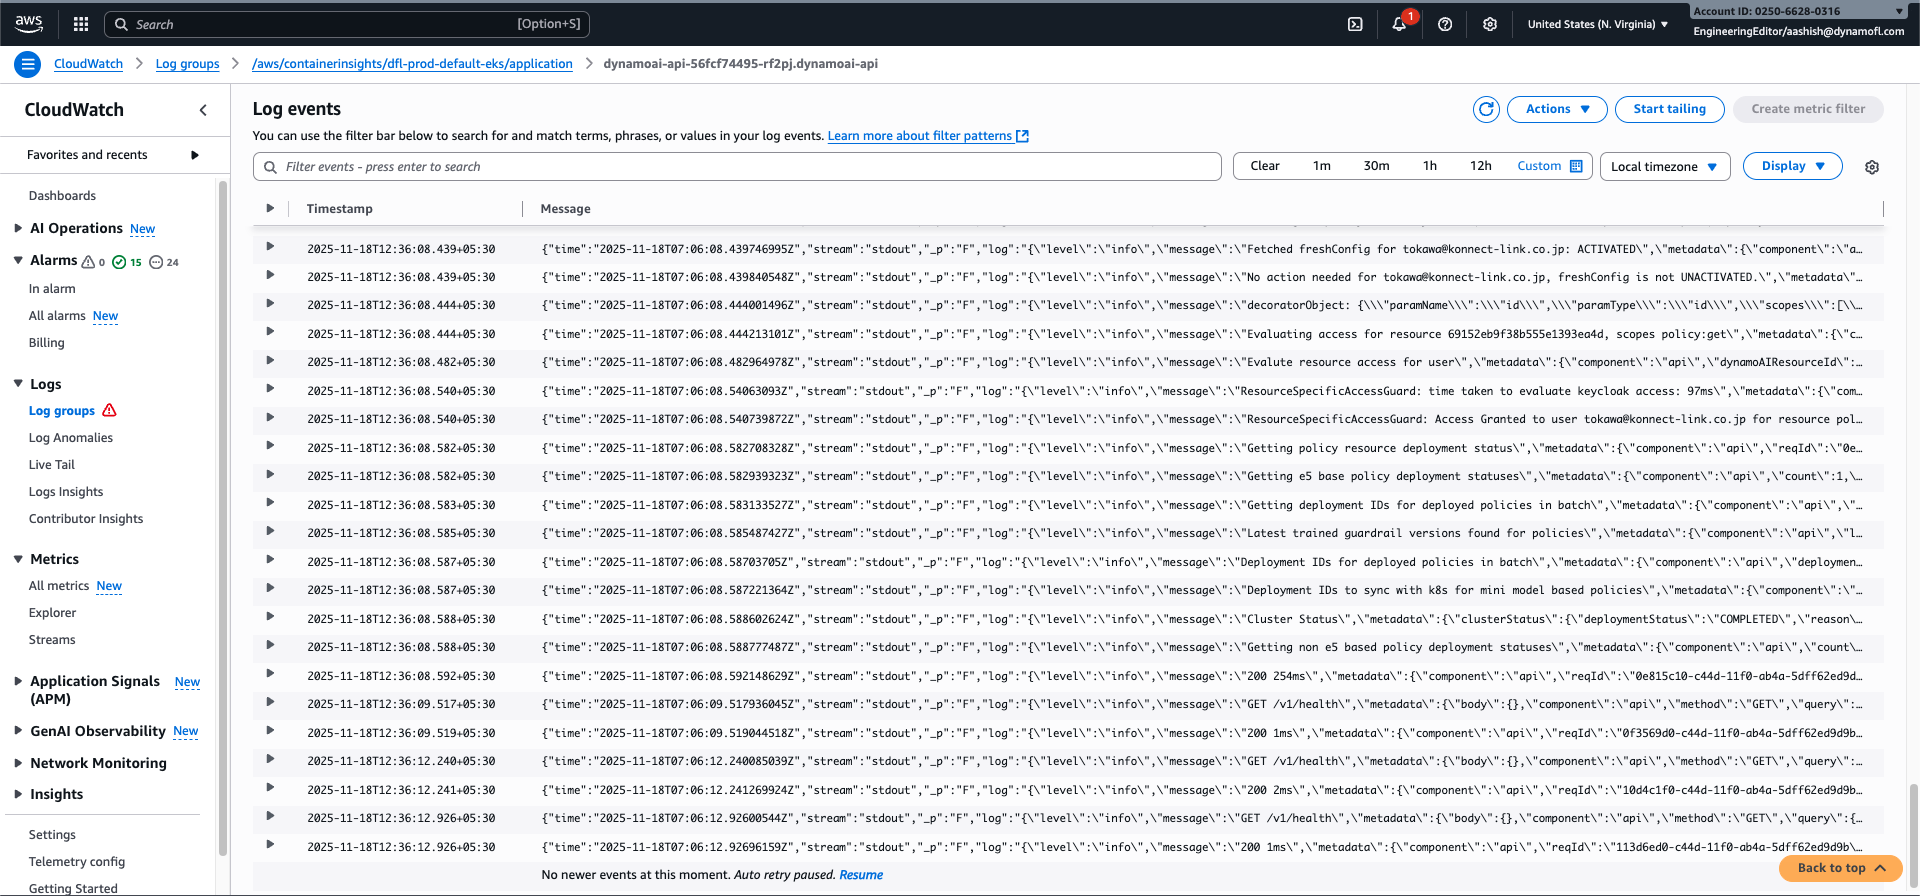
Approach 1: CloudWatch Log Streams (Direct Viewing)
Best for: Quickly viewing logs from a specific pod/component, general log browsing
Steps:
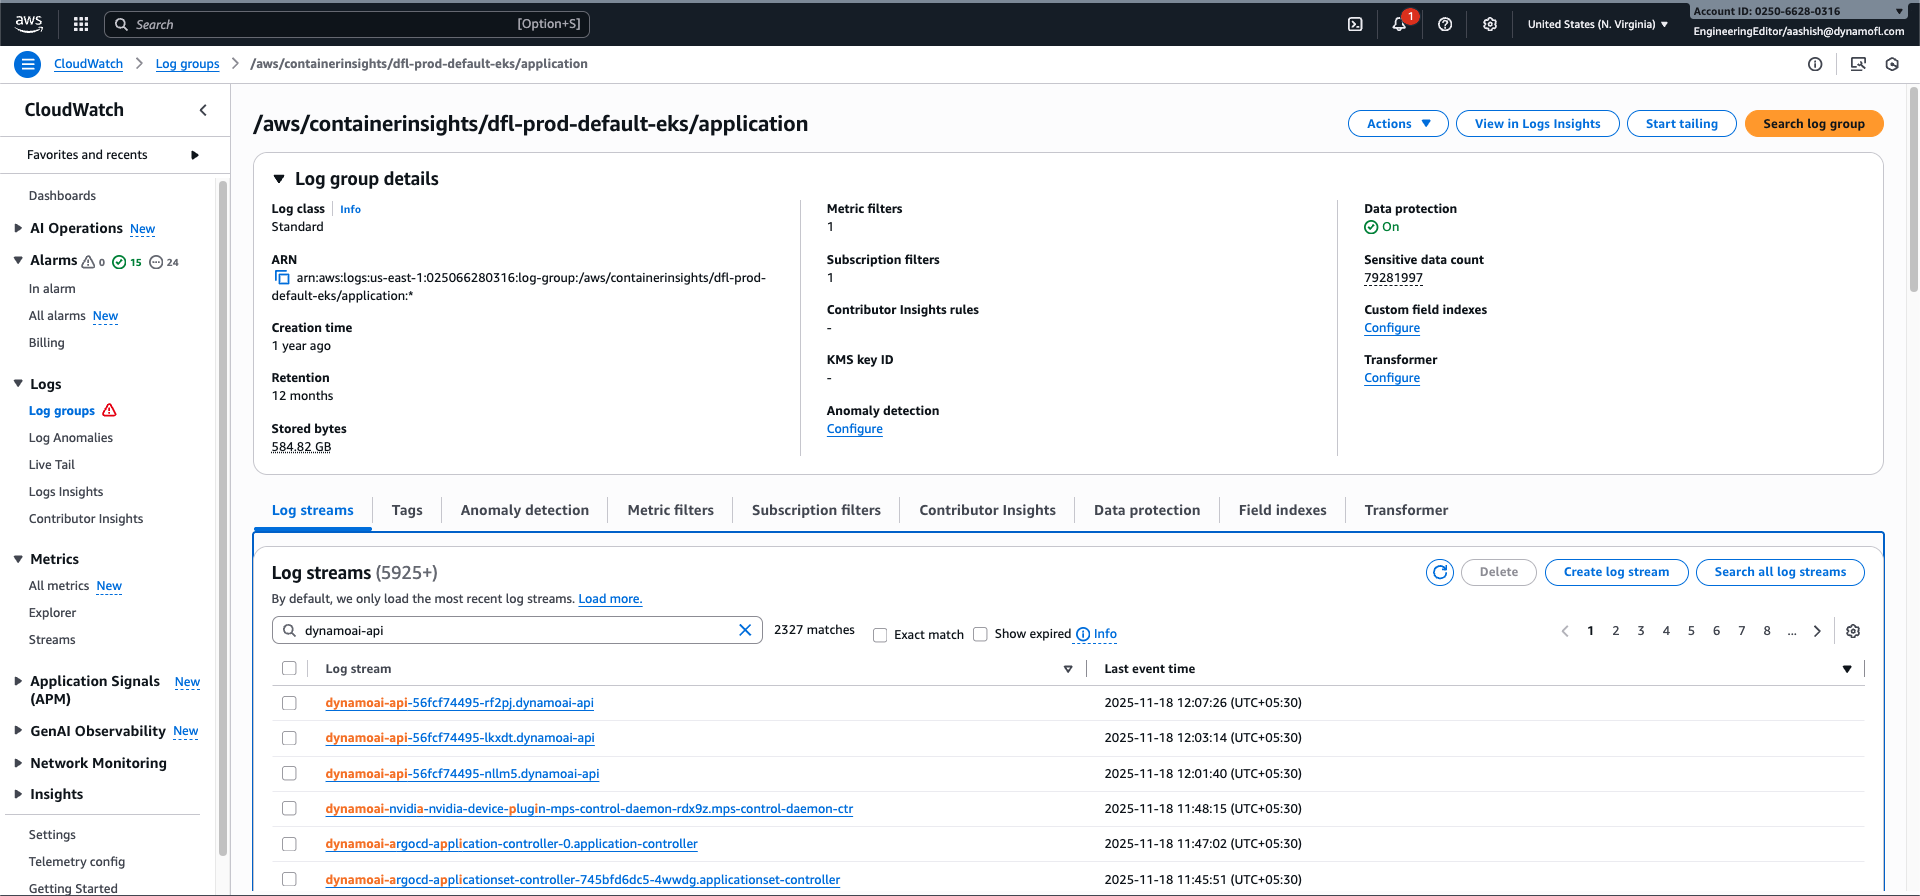
- Go to AWS CloudWatch Console - Log Groups
- Select the log group:
/aws/containerinsights/${CLUSTER_NAME}/application(replace${CLUSTER_NAME}with your cluster name, e.g.,dfl-prod-default-eks) - Click on the log stream you want to view (e.g.,
dynamoai-api-56fcf74495-rf2pj.dynamoai-api)
Approach 2: CloudWatch Insights (Query-Based)
Best for: Filtering logs by structured attributes, searching across multiple streams, complex queries
CloudWatch Insights allows you to query logs using a SQL-like syntax, making it ideal for filtering by structured logging attributes.
Access: AWS CloudWatch Insights
CloudWatch Insights Queries
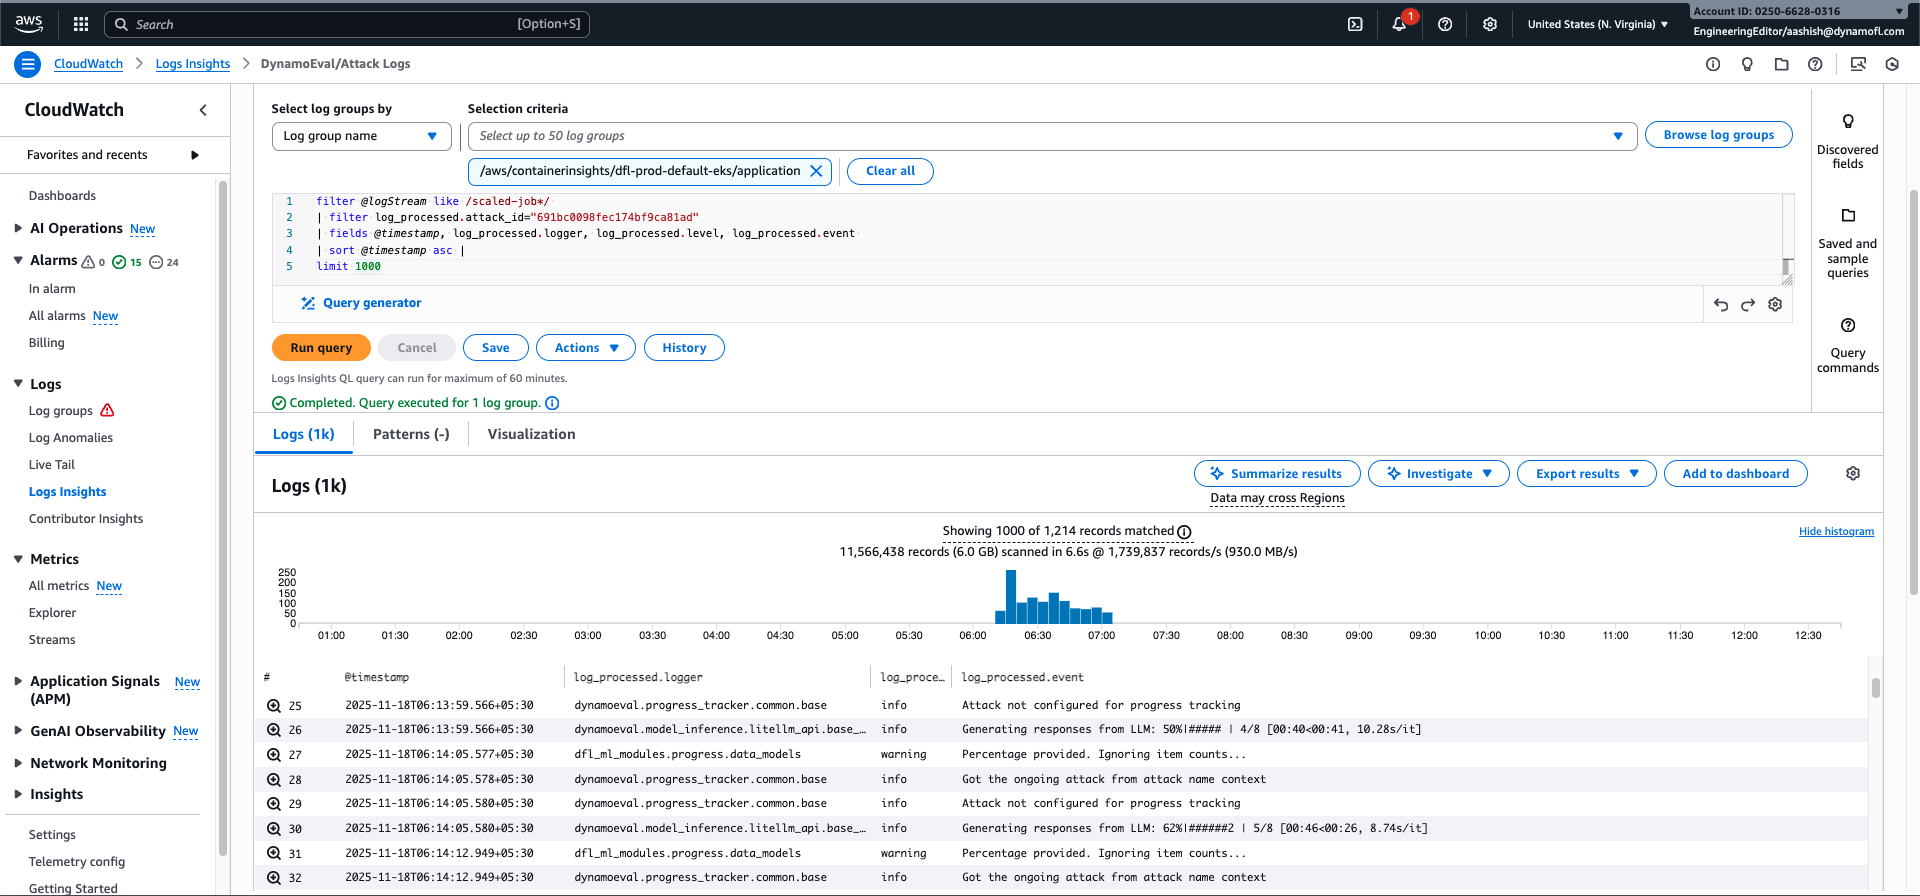
DynamoEval: Attack Logs
View all logs for a specific DynamoEval attack. This query filters to log streams that follow the attack naming convention (starting with scaled-job).
Query:
filter @logStream like /scaled-job*/
| filter log_processed.attack_id="691bc0098fec174bf9ca81ad"
| fields @timestamp, log_processed.logger, log_processed.level, log_processed.event
| sort @timestamp asc
| limit 1000
Steps:
- Select the log group:
/aws/containerinsights/${CLUSTER_NAME}/application(replace${CLUSTER_NAME}with your cluster name, e.g.,dfl-prod-default-eks) - Select the time range for when the attack was executed
- Replace
691bc0098fec174bf9ca81adwith your actual attack ID - Run the query
DynamoEval: Test Report Generation Logs
View all logs for a specific test report generation job. This query filters to log streams that follow the test report generation naming convention (starting with testreportgeneration).
Query:
filter @logStream like 'testreportgeneration%'
| filter log_processed.product="dynamoeval"
| filter log_processed.component="test-report-generation"
| filter log_processed.test_id="584d3a37a75f463c4a4c0397"
| fields @timestamp, @logStream, log_processed.logger, log_processed.event
| sort @timestamp asc
Steps:
- Select the log group:
/aws/containerinsights/${CLUSTER_NAME}/application(replace${CLUSTER_NAME}with your cluster name, e.g.,dfl-prod-default-eks) - Select the time range for when the test report generation was executed
- Replace
584d3a37a75f463c4a4c0397with your actual test ID - Run the query
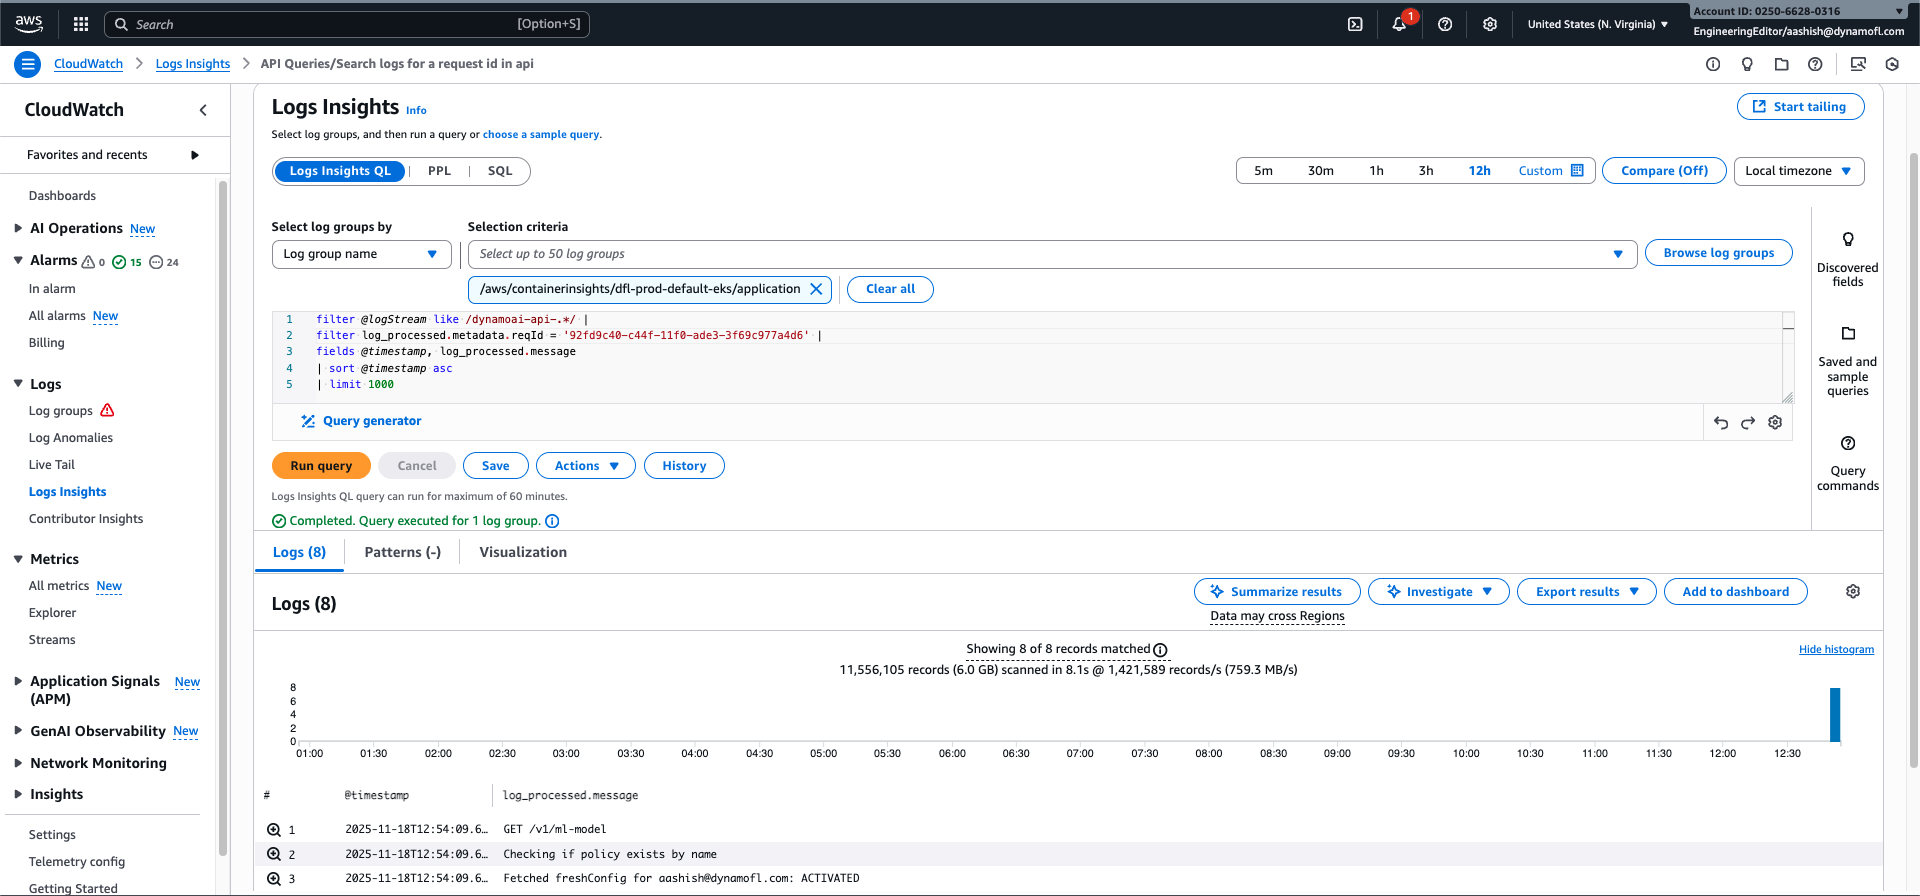
API: View Logs for a Specific Request
Trace all logs related to a specific API request using the request ID. This query searches across all API pods.
Query:
filter @logStream like /dynamoai-api-.*/
| filter log_processed.metadata.reqId = '19e555d0-b349-11f0-9ee0-09606a1108f9'
| fields @timestamp, log_processed.message
| sort @timestamp asc
| limit 1000
Steps:
- Select the log group:
/aws/containerinsights/${CLUSTER_NAME}/application(replace${CLUSTER_NAME}with your cluster name) - Replace
19e555d0-b349-11f0-9ee0-09606a1108f9with your request ID (found in theX-Request-Idresponse header) - Run the query
API: View Error Logs
Find all error-level logs from all API pods.
Query:
filter @logStream like /dynamoai-api-.*/
| filter log_processed.level = 'error'
| fields @timestamp, log_processed.message
| sort @timestamp asc
| limit 1000
Steps:
- Select the log group:
/aws/containerinsights/${CLUSTER_NAME}/application(replace${CLUSTER_NAME}with your cluster name) - Adjust the time range as needed
- Run the query
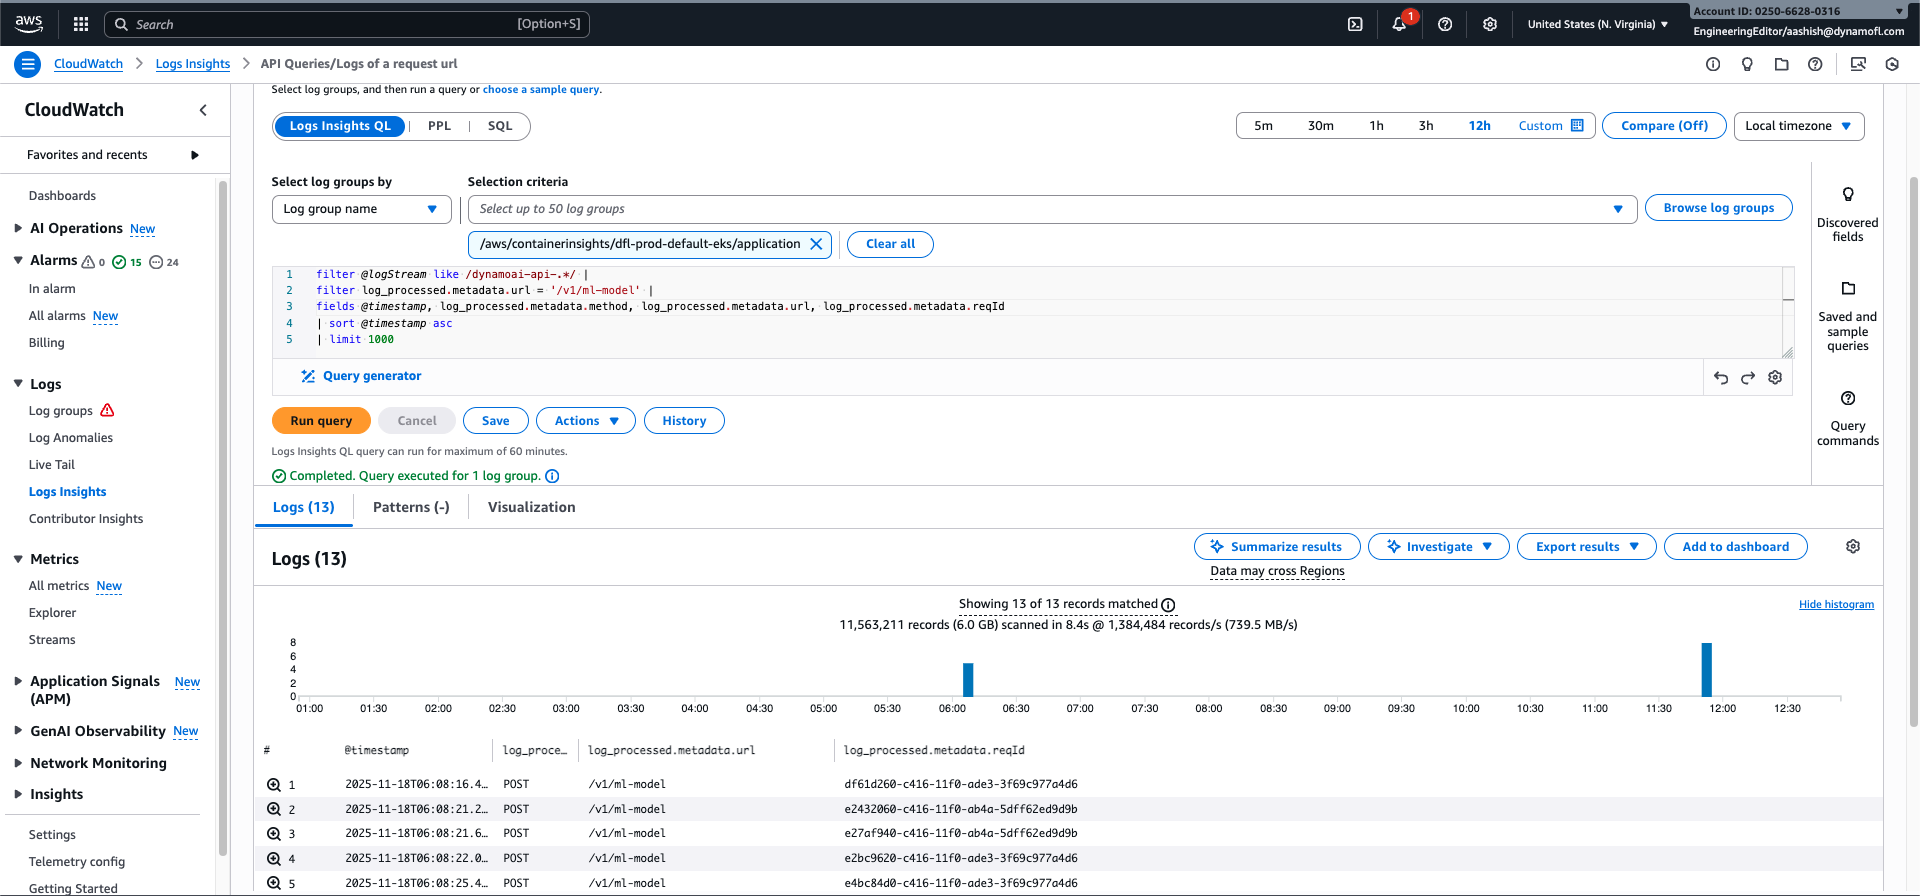
API: View Request Entry Points for a Specific Route
View the history of requests made to a specific API route across all API pods, including request IDs for further investigation.
Query:
filter @logStream like /dynamoai-api-.*/
| filter log_processed.metadata.url = '/v1/ml-model'
| fields @timestamp, log_processed.metadata.method, log_processed.metadata.url, log_processed.metadata.reqId
| sort @timestamp asc
| limit 1000
Steps:
- Select the log group:
/aws/containerinsights/${CLUSTER_NAME}/application(replace${CLUSTER_NAME}with your cluster name) - Replace
/v1/ml-modelwith the API route you want to investigate - Run the query
DynamoGuard: Trace Analyze Request Across Components
Trace all logs for a single DynamoGuard analyze request from API through Moderation Server to Models.
Step 1: Get the API Request ID
- The API request ID is returned in the response header as
X-Request-Id - Or find it in API logs using the API request query above
Step 2: View API Logs for the Analyze Request
filter @logStream like /dynamoai-api-.*/
| filter log_processed.metadata.reqId = '19e555d0-b349-11f0-9ee0-09606a1108f9'
| fields @timestamp, log_processed.message
| sort @timestamp asc
| limit 1000
Step 3: View Moderation Server Logs for the Same Request
filter @logStream like /dynamoai-moderation-.*/
| filter trace_id = '19e555d0-b349-11f0-9ee0-09606a1108f9'
| fields @timestamp, trace_id, request_id, log_processed.message
| sort @timestamp asc
| limit 1000
Step 4: View Model Logs for the Same Request
filter @logStream like /model-.*/
| filter request_id = '19e555d0-b349-11f0-9ee0-09606a1108f9'
| fields @timestamp, request_id, log_processed.message
| sort @timestamp asc
| limit 1000
Steps:
- Select the log group:
/aws/containerinsights/${CLUSTER_NAME}/application(replace${CLUSTER_NAME}with your cluster name) - Replace
19e555d0-b349-11f0-9ee0-09606a1108f9with your API request ID (fromX-Request-Idheader) - Run all three queries to see the complete flow from API → Moderation Server → Models
- Note: A single API analyze request may result in multiple Moderation Server calls, each with a different
request_id(worker_request_id) but the sametrace_id - The same request ID value (
log_processed.metadata.reqIdin API =trace_idin Moderation Server =request_idin Models) allows you to trace the entire request flow
Tips for CloudWatch Log Exploration
- Finding the Right Log Stream: Use the component identification patterns from the Generic Component Logs guide to identify which log stream to query. Log streams follow the pattern
${POD_NAME}.${CONTAINER_NAME} - Time Ranges: CloudWatch Insights queries are more efficient with narrower time ranges. Start with a specific time window and expand if needed
- Request ID Tracing: The API request ID (
X-Request-Idheader) is your best friend for tracing a request through all related logs. For DynamoGuard analyze requests, use the API request ID astrace_idin Moderation Server logs to trace the complete flow - Multiple Streams: The API queries in this guide use
@logStream like /dynamoai-api-.*/to search across all API pods. You can use similar regex patterns for other components (e.g.,@logStream like /mongodb-.*/for MongoDB) - Single Log Group: All application logs are in one log group (
/aws/containerinsights/${CLUSTER_NAME}/application), making it easy to search across all components - Saving Queries: CloudWatch Insights allows you to save frequently used queries for quick access